Trading Journal & Blog
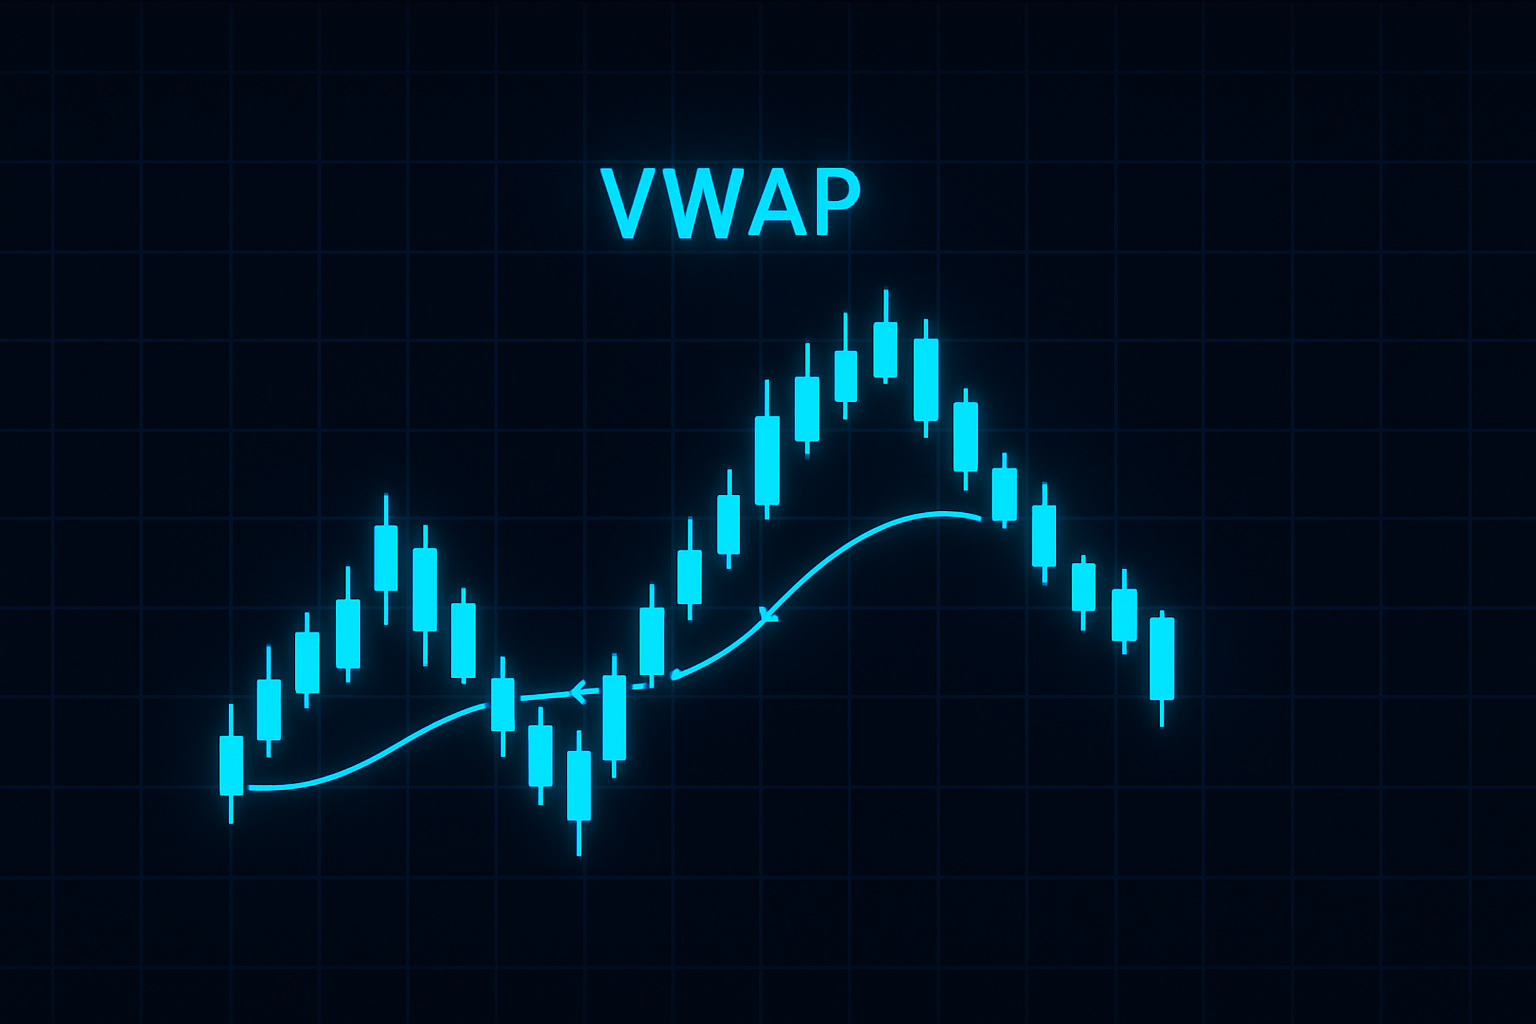
What is VWAP and How to Use It in Trading? The Volume Weighted Average Price (VWAP) is a powerful and widely-used trading indicator that helps traders gauge the average price of an asset, adjusted for its trading volume. Unlike simple moving averages, VWAP incorporates both price and volume into its calculations, making it an invaluable…
Risk Management: How Much Should You Risk Per Trade? When it comes to trading, risk management is one of the most critical aspects of staying profitable and protecting your capital. One popular rule of thumb is to risk only 1-2% of your account per trade. But what does this actually mean? Let’s break it down.…
Pre-Trade Entry Checklist 1. General Criteria (Before Analyzing a Setup) ☑ Am I trading during active market hours? ☑ Are there no major news events likely to cause erratic price movements? ☑ Is the trading pair liquid enough for clean price action and minimal slippage? ☑ Am I sticking to my set leverage (5x) and…
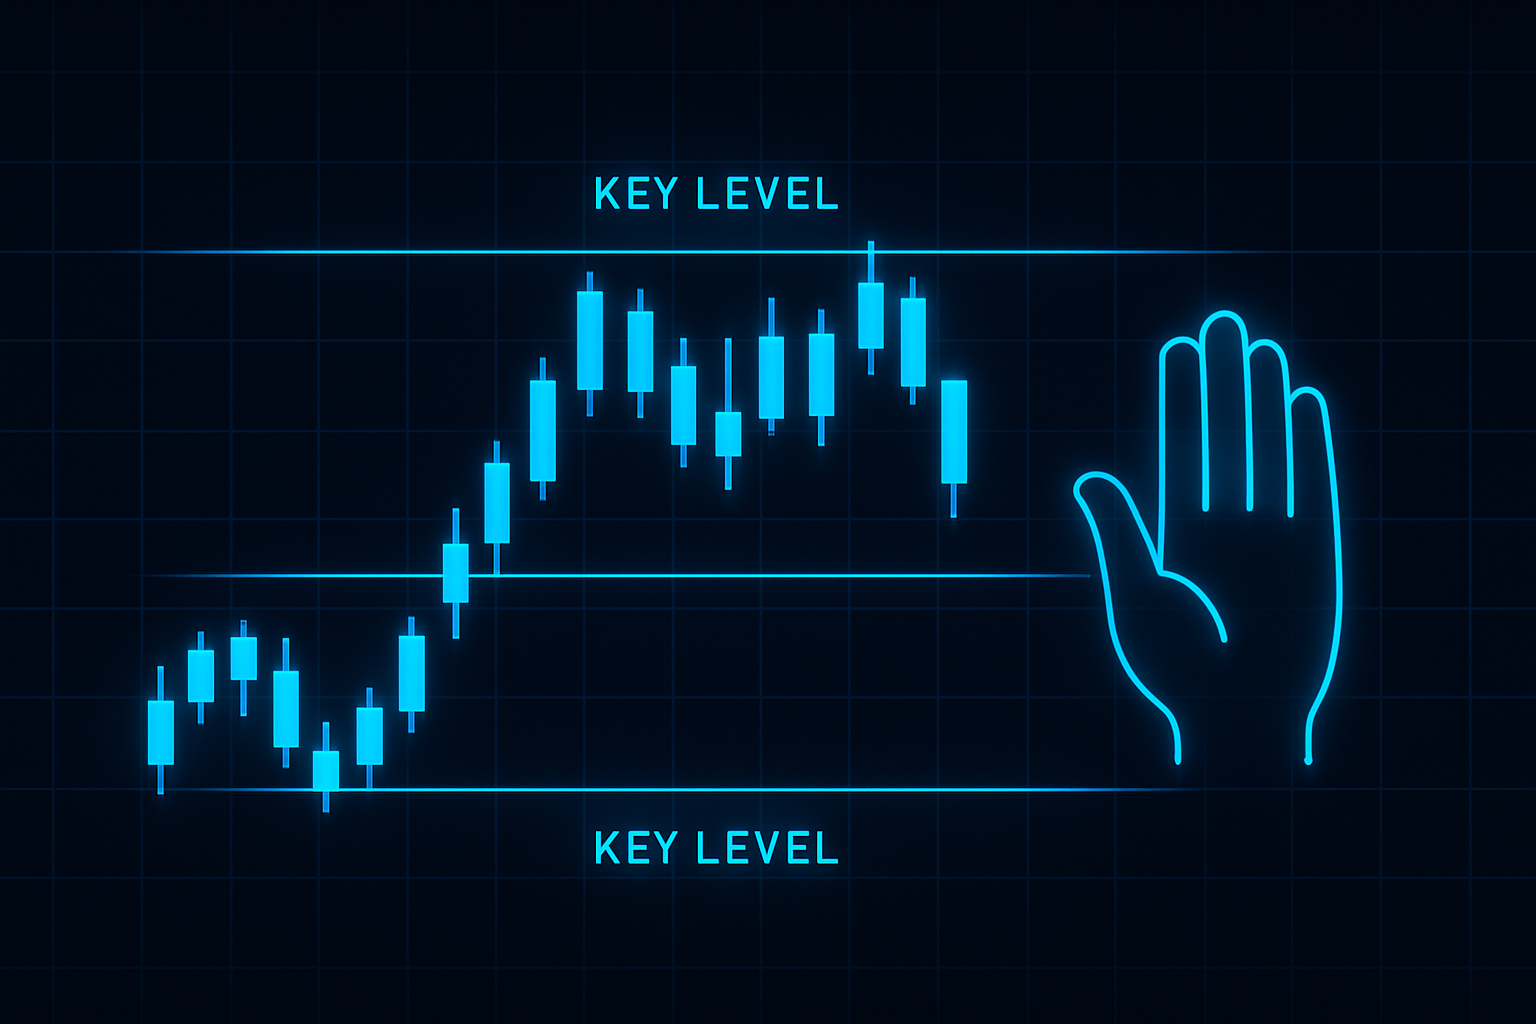
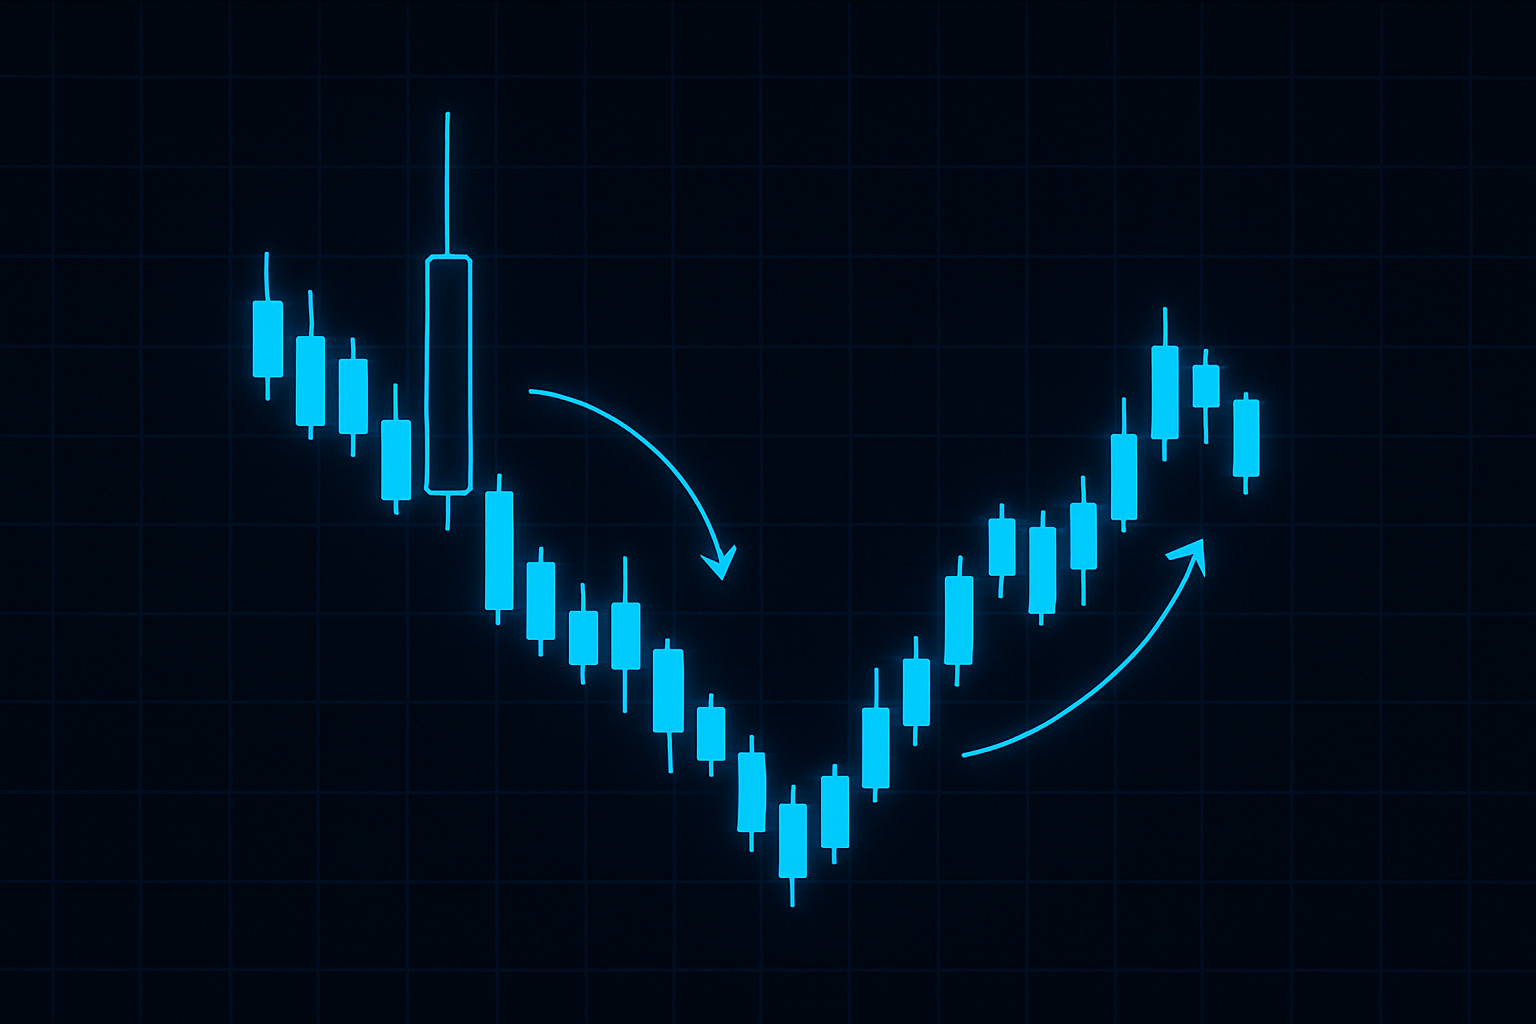
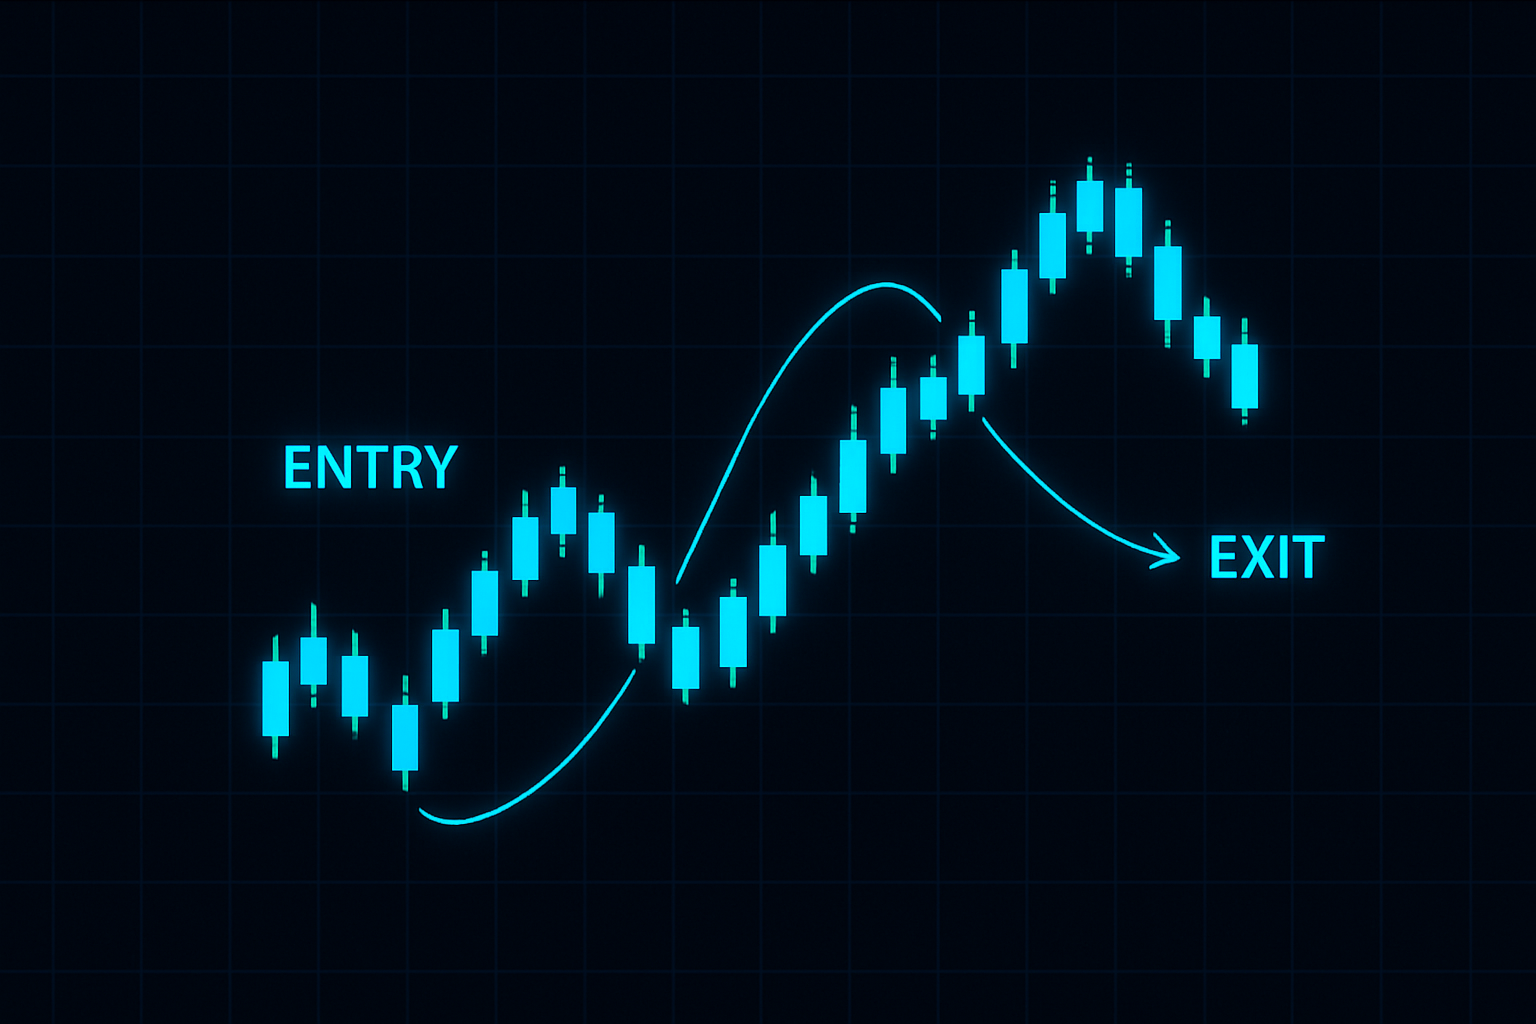
Finding Good Trade Entries at Key Levels: The Art of Patience and Emotional Contro Trading is more than just numbers on a chart—it’s a test of discipline, patience, and emotional resilience. Whether you’re new to trading or have a few wins under your belt, one thing remains constant: finding good entries at key levels is…
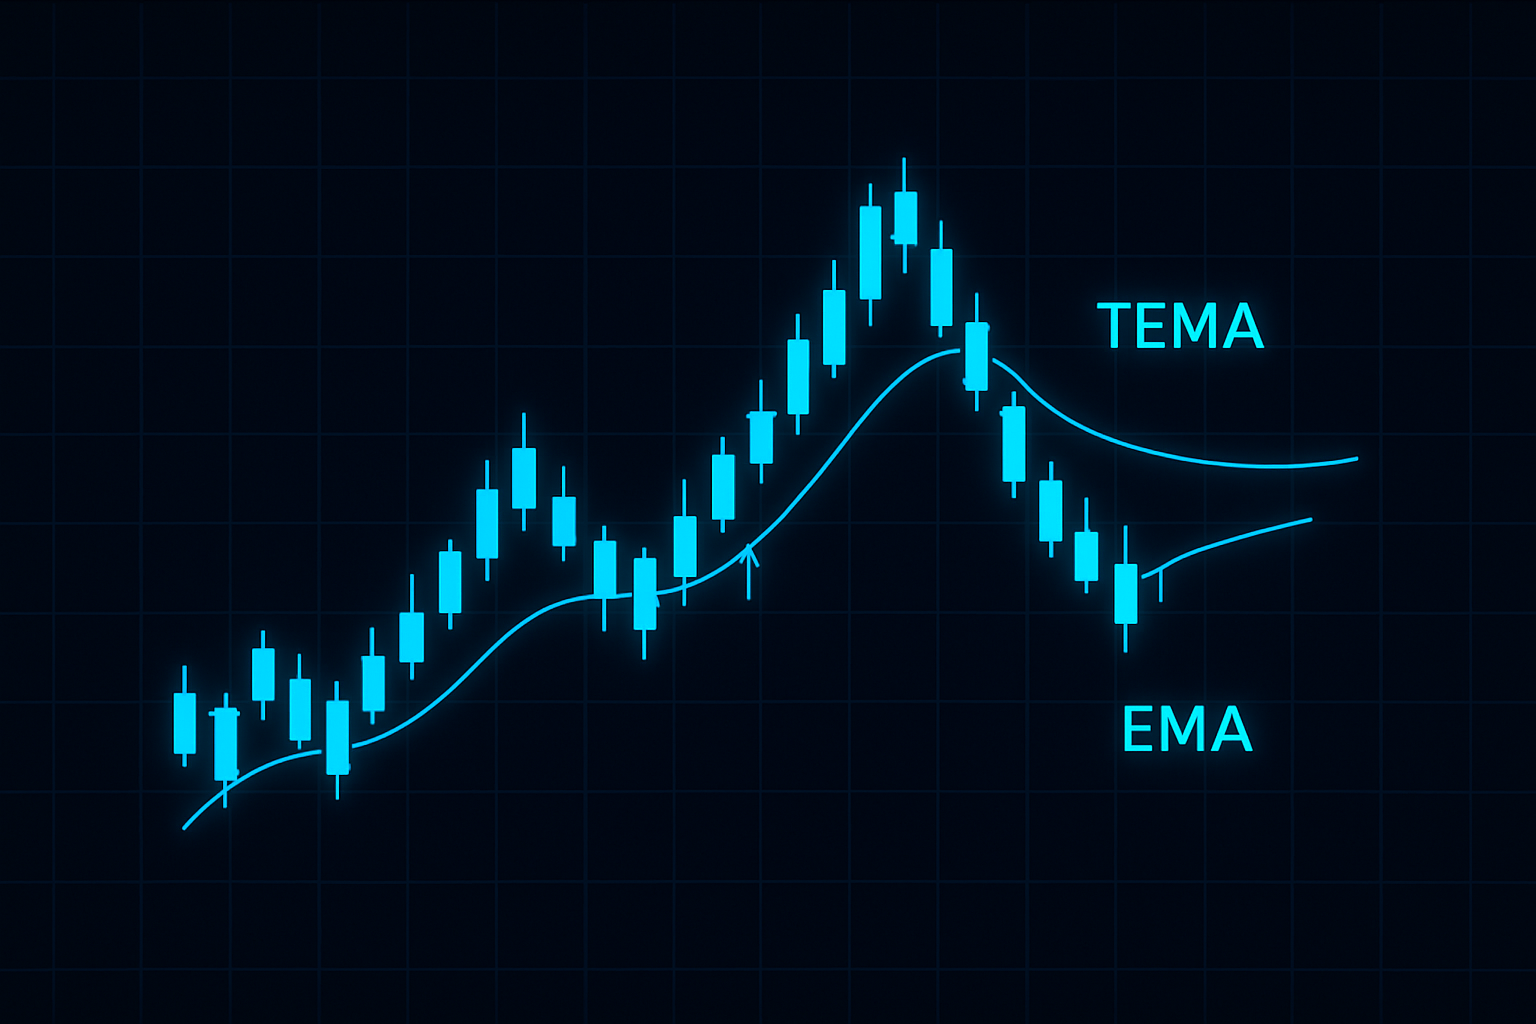
Master the TEMA Indicator on TradingView: A Guide for Smarter Trading When it comes to technical analysis, traders are constantly seeking tools that can help them spot trends earlier and more accurately. The Triple Exponential Moving Average (TEMA) is one such indicator designed to reduce lag while providing a smooth and responsive trend line. In…
Understanding Wick Fills in Crypto Trading: How to Use Them for Profitable Trades When analyzing candlestick charts, traders often focus on wicks (also known as shadows) as key indicators of potential price movement. In this post, we’ll explore what wicks are, what it means when a wick is “filled,” and how you can incorporate wick…
Swing Trade Setup What is Swing Trading? Swing trading is a strategy focused on capturing price movements over a few days to weeks. Traders look for short- to medium-term trends or reversals using technical and fundamental analysis. Key Indicators for Swing Trading RSI (Relative Strength Index): Look for oversold (<30) or overbought (>70) levels to…
BTC.D Cheat Sheet Rising BTC.D (Bitcoin Gaining Dominance) What It Means: Bitcoin outperforms altcoins (BTC price rising faster or altcoins losing value). Traders favor Bitcoin as a “safe haven.” Market Implications: Altcoins likely underperform or drop in value. Risk-off sentiment in the market. When to Watch: Bullish BTC runs. Crypto market uncertainty. Falling BTC.D (Altcoins…